Smart Motorway Billboard
Introduction
In recent years, “Smart Motorways” have been rolled out across the UK. These are sections of motorways that make use of active traffic management techniques to increase capacity and reduce congestion [1]. Smart motorways are monitored via automated (MIDAS vehicle detection) and manual (CCTV) methods [2] and the techniques employed to improve traffic conditions and safety include dynamic speed limits and basic matrix displays [3] capable of showing short text messages or simple diagrams (MS3/MS4) [4]. Despite the detailed traffic information gathered by these systems and available to road operators, little of this information is available to drivers and the public.
This project proposes large digital billboards that could be placed next to or above motorway routes, replacing or supplementing existing matrix displays and presenting more of the available data to road users. This would enable drivers to make more informed route choices by alerting them of traffic conditions, improve safety by informing drivers of dangerous conditions such as ice or snow, notify them of upcoming services and display messages set by road operators (such as reminding drivers to wear a seat belt). Additionally, this project proposes making real-time traffic information available via an API so that it can be utilised by the public (e.g. by Sat-nav apps).
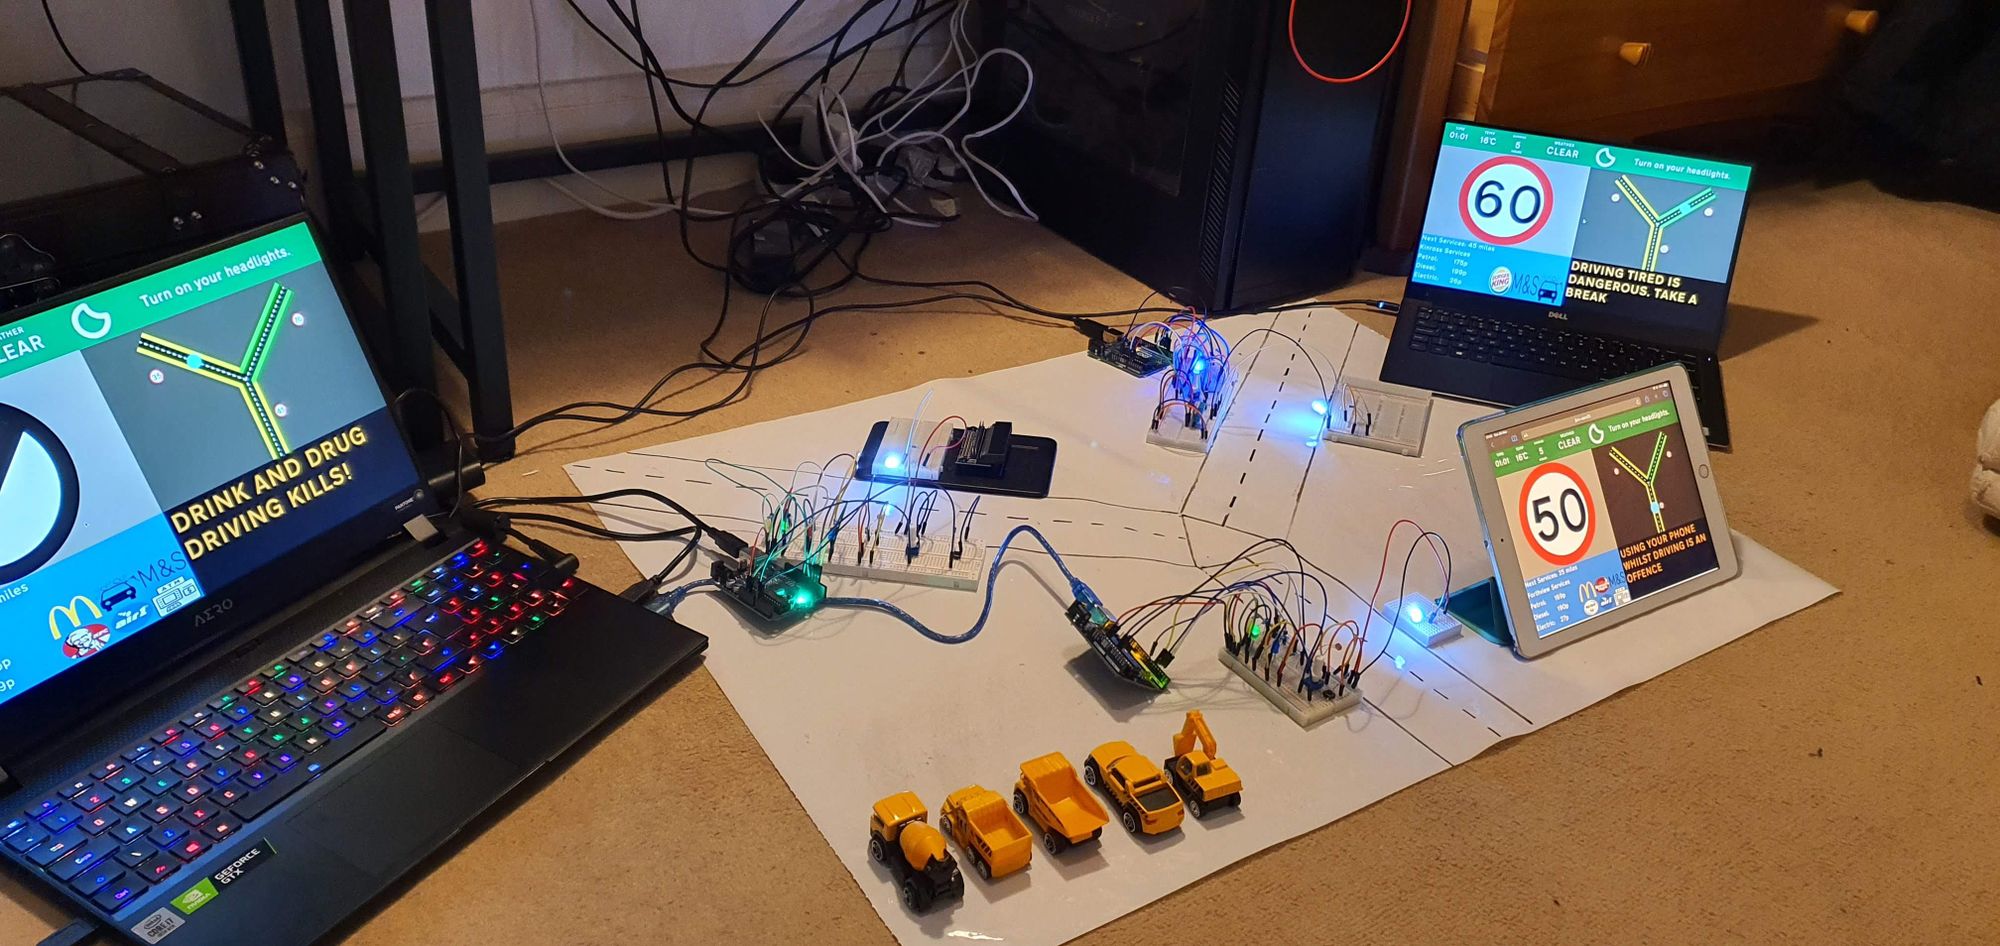
In this project, a small model road network is constructed and equipped with model traffic sensors. The traffic sensors are based on the Arduino platform and use light sensors to detect vehicles and estimate their speeds, as well as measuring the road temperature. The traffic sensors are connected to a computer which runs a Node.js based server. The server decodes the traffic sensor information and makes it available via an API. Additionally, the server serves a P5 based web app which presents the data in a billboard friendly format. These servers can be connected to a network of servers and share information between themselves.
Code here: https://git.jbm.fyi/jbm/Smart_Motorway_Billboard
Demo Video
Demonstration Video
Interaction Overview
Parts List
Hardware
- 3 x Arduino Uno (with serial cable)
- 6 x Breadboard
- 3 x White LED
- 3 x Red LED
- 3 x Green LED
- 3 x Yellow LED
- 3 x 10KΩ potentiometer
- 3 x Light dependent resistors
- 3 x 10KΩ resistors
- 12 x 220Ω resistors
- 1 x DHT11 Heat/Humidity Sensor
- 3 x push-to-make buttons
- Assorted jump wires
- 1 Laptop with 3 USB ports
- 2 Web capable devices or monitors(Optional)
- Toy Cars(Optional)
- Scale roadway drawing (Optional)
Software
- Arduino IDE
- Visual Studio (or other IDE)
- Node.js [11]
- NPM (Node Package Manager) [12]
- Web browser
- (Optional) Git
Process
Traffic Sensor
The first step in the project was designing the traffic sensors. The most important feature of the traffic sensors is the ability to detect if a vehicle is in front of them. The first iteration of the traffic sensor simply consisted of an Arduino, Light Dependent Resistor (LDR), a white LED, and a red LED. The LDR was set up as part of a potential divider circuit where the output of the potential divider was connected to one of the Arduino analogue ports. This meant that the output voltage of the potential divider would be higher the more the LDR is exposed to light. The white LED was directed at the LDR and the Arduino was programmed to turn the red LED on if the voltage coming into the analogue port is higher then a certain threshold and off otherwise. After finding the right threshold, the red LED would be turned on if an object was placed in between the white LED and the LDR. This formed the basis of the traffic sensor.
A problem quickly became evident: even small changes in the distance between the LDR and LED would require adjustments to the threshold value. Additionally, manufacturing tolerances on the LDRs meant that different LDRs would also require different thresholds. Therefore, a way to adjust the sensitivity of the LDR was needed. This problem was solved by adding a 10KΩ potentiometer to the circuit. The potentiometer could have replaced the resister in the LDR’s potential divider circuit and the threshold set to a hardcoded value, but I instead decided to connect it to another one of the Arduinos analogue ports so that the threshold value could be adjusted dynamically and output over serial for debugging purposes.
Next, the temperature sensor was added. The temperature sensor used is the DHT11 digital humidity and temperature sensor. The Adafruit DHT library [10] is used to retrieve the temperature value from the sensor. I only had access to one temperature sensor but I wanted to build 3 traffic sensors. This meant that only one of the Arduinos would have a temperature sensor, and the other two would have to retrieve the temperature value from the DHT-equipped Arduino. I didn’t want to have separate programs for the two different traffic sensors, so each needed a way of determining if they had a traffic sensor or not. In order to facilitate this, I added a push-to-make button connected to one of the digital input pins of the Arduino, +5v and to ground via a pull-down resistor. This enables the Arduino to set a temperature flag. A blue LED was also added to indicate if the Arduino is in temperature mode.
The final step for the circuitry part of the project was programming the Arduinos. The basic program structure is to loop a certain number of times per second. This value can be set by adjusting the READINGS_PER_SECOND constant. From the value of this constant, the number of milliseconds each loop should take is calculated. The duration of each loop is timed, and at the end of the loop, the Arduino delays for the appropriate number of milliseconds to make sure the total time spend in the loop is correct. A second constant, SECONDS_PER_PERIOD, sets the number of seconds in each measurement period. A Boolean array of size READINGS_PER_SECOND* SECONDS_PER_PERIOD is then used to store the traffic data.
In the demo video I used 25 readings per second and 10 seconds per period. When used in a real world setting a larger number of seconds per period would be warranted to smooth the data. There is a practical upper limit to the number of readings per second based on the processing speed of the Arduino. For the Uno, this seems to be about 50 readings per second. Higher values offer higher resolution data, but requires more memory.
During each loop a number of actions take place. First the button state is checked and if it is found to be pressed, the temperature flag is toggled. Once toggled, the new value is also saved into the EEPROM so that it can be persisted even if the Arduino restarts (the EEPROM is checked during the setup function). If the temperature flag is set, a temperature reading is taken and the blue LED is turned on. Otherwise, the blue LED is turned off and the temperature value is set to a magic number indicating that no temperature sensor is present. Next the potentiometer value is measured and the threshold value set accordingly. Once this has been done, the LDR reading is taken and a Boolean variable is set indicating whether or not a vehicle is in front of the sensor. The next free value in the traffic data array is then populated with this variable. If the traffic data array is full, the program enters an update step after which the traffic data array is cleared and the process restarts. Finally, the necessary delay is executed to ensure each iteration is of the correct length.
During an update step, the program first calculates two statistics – the number of vehicles that passed the sensor during the measurement period, and the average amount of time that the sensor was obscured for. The number of vehicles that passed the sensor is calculated by iterating through the traffic data array and counting the number of times that a true value (indicating that a vehicle is detected) is followed by a false value. The average time the sensor is obscured is calculated by dividing the total amount of the time the sensor is obscured during the period by the number of vehicles that passed the sensor. The total amount of time the sensor is obscured is calculated by multiplying the total number of trues in the traffic array by the number of milliseconds per iteration - this is why it is essential that each iteration takes approximately the same amount of time.
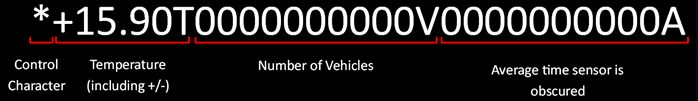
The final part of the update step is sending a package of data to the connected computer via the serial port. The data is packed in the format shown in figure 1. The string always starts with a control character that is set using a constant in the code, and is always exactly 30 characters long. This is so that corrupt strings can be easily identified and discarded. The temperature value is found in between the control character and the letter T, number of vehicles found between T and V and the average time is found between V and A. These properties make it easy to extract the values on the other end. The number of vehicles and average time values are padded with zeros to ensure they are 10 digits long as this enables the largest 32-bit (long) value to be stored without changed the length of the string. Similarly, the operating range of the DHT sensor is 0.00°C – 50.00°C and so the temperature value is padded if necessary to ensure it takes up 5 digits (including the decimal place). Although this sensor is not capable of reading negative values, negative values would be common on the road and so if deployed, the traffic sensors should be equipped with sensor capable of measuring negative values and so the sign of the temperature value is always included.
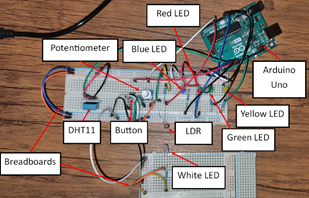
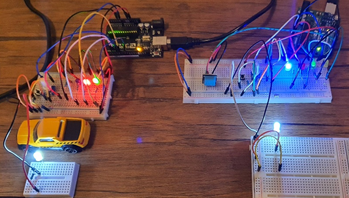
Two more LEDs were added to the traffic sensors to provide status feedback. A green LED is pulsed every iteration of the loop so that it is easy to detect if the Arduino has crashed or if any iteration is taking too long. A yellow LED is pulsed every time an update step occurs. Figure 2 shows an image of one of traffic monitoring sensors with all of the components labelled. Figure 3 shows the two different types of traffic sensors. The one on the left does not have a temperature sensor and its blue light is off as a result. However, it is blocked by a car, hence the red light is on. The one on the right does have a temperature sensor and as a result the blue light is turned on.
Billboard/Server
Each of the traffic sensors are connected to a computer running a server (one per sensor). All of them can be connected to the same computer (as shown in the demo video) or they can be connected to different computers, as long as they can access each other across the network. The server has 3 jobs: take delivery of and decode data packages from the Arduino (over serial), share this data via an API and serve a website – the digital billboard.
The server has a configuration file (conf/settings.json) where the administrator can set: network port, an API key for the weather API, latitude/longitude position of the sensor, threshold for high wind speeds, frequency to update configurations/weather/temperature data/traffic data, serial port of the Arduino, baud rate, average vehicle length and the addresses of other sensors in the cluster. There are also configuration files to store all the static information displayed on the sign, but these can also be updated via the API instead.
The server uses the node.js platform and is based on the express [13] framework. The first task of the server is conducted simply by using the serialport [14] NPM package to listen to the serial port and extract the various items of data. Other node packages used are body-parser [15], node-fetch [16] and nodemon [17]. The server offers two APIs. The first is called roadside and provides low level information from the traffic sensor:
host/roadside/serial – returns the last serial message from the roadside unit.
host/roadside/vehicles – returns the number of vehicles that passed the sensor during the last update step.
host/roadside/speed – returns the average speed of vehicles passing the sensor during the last update step in both m/s and mph. The speed is calculated based on the average length of vehicles in the UK, which is 4.4m. That is, the average time given is the average time to travel 4.4m and the average speed can be calculated from this.
The second API is simply called api and provides high level information intended to be consumed by the billboard, or to configure static information on the billboard (such as speed):
host/api/info – returns all of the information needed by the billboard, except the speed information from the traffic sensors. This consists of the current time, the temperature, a flag indicating night/day, time until sunrise/sunset, the unit for this time (hours/minutes), current weather conditions, a list of messages to associate with each weather condition, the speed limit, a list of messages to display, and information about upcoming services. The temperature value is retrieved from the traffic sensor. If a temperature sensor is not connected to the local traffic sensor, the server will query all of the other servers in the cluster. The weather conditions and time until sunrise/sunset is retrieved from the Open Weather Map API (https://openweathermap.org/).
host/api/cluster – returns the URL and average speed of the local traffic sensor, and all other sensors in the cluster. The average speed is retrieved from the other sensors by querying their APIs.
host/api/messages – used to configure the messages displayed in the bottom right of the billboard.
host/api/services – used to configure the services information (including icon URLs) in the bottom left of the billboard.
host/api/speed – used to update the speed limit displayed in the centre left of the billboard.
host/api/conditions – used to update the messages associated with weather conditions displayed at the top left of the billboard.
Other then the last 5 api routes, all the routes are GET routes. The last 5 routes are POST routes intended to be used by the road operators to customise and update the billboards. This would enable the operators to dynamically adjust the speed limits, update fuel price, etc.
Other then providing API routes, the server also serves a folder (host/static/[path]) and a html document (index.html). The static folder contains resources needed by the billboard including images, fonts, stylesheets, the P5 JavaScript library and a P5 sketch. The html document is served if any unrecognised path is accessed on the server and simply loads the stylesheet, P5 library and then executes the P5 sketch.
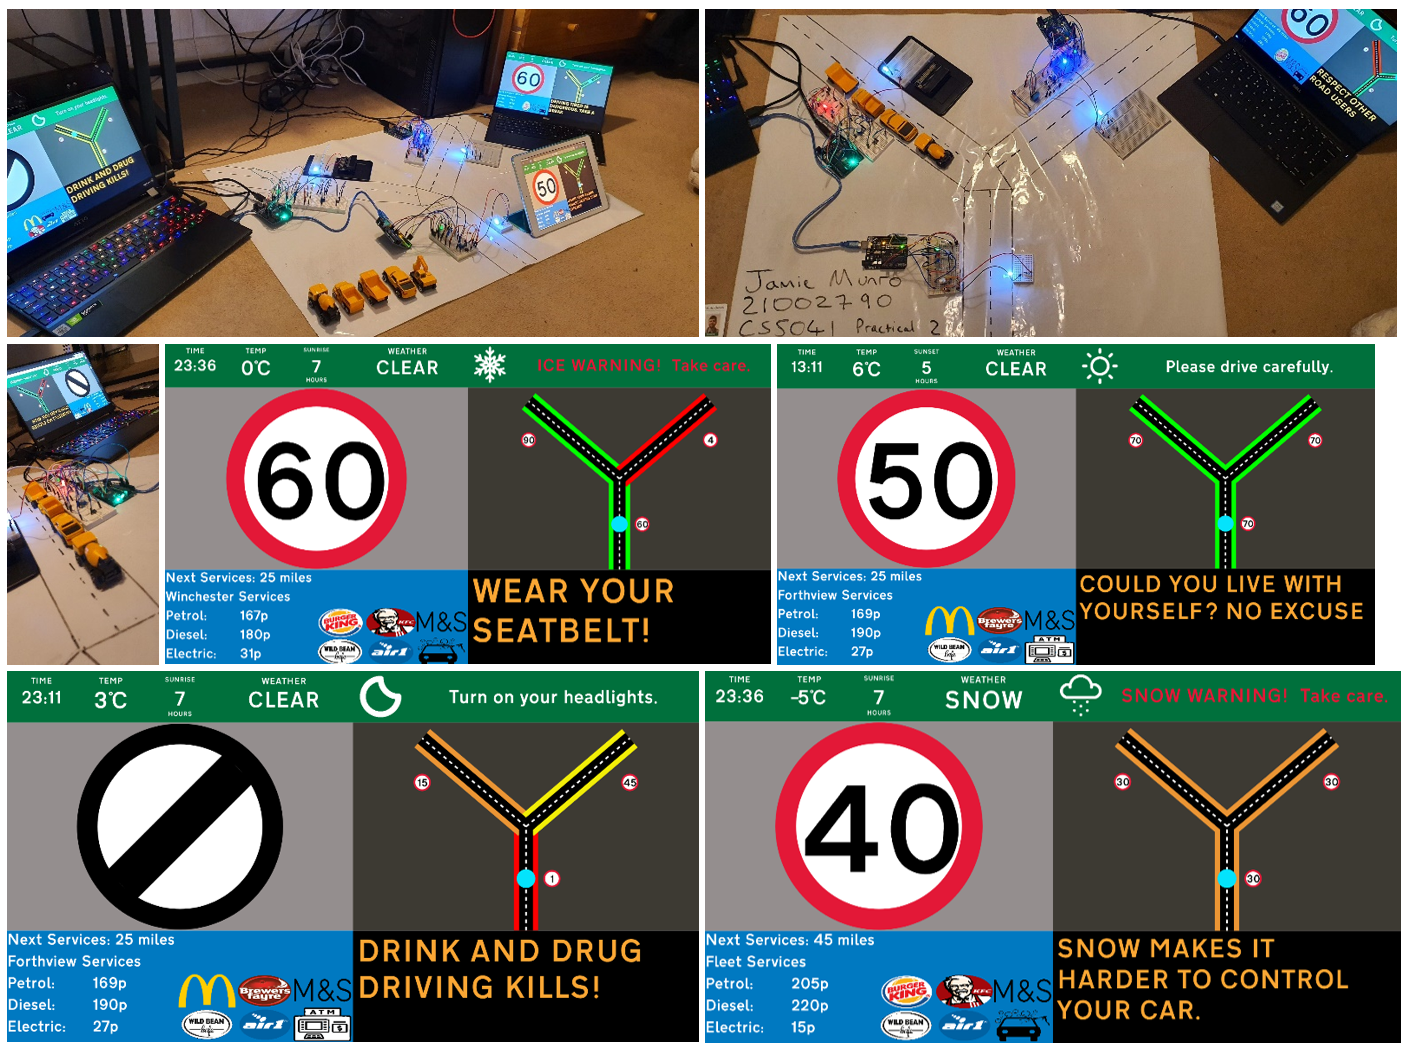
The P5 sketch performs the job of displaying the billboard. All the information needed by the sketch is provided by the /api/info and /api/cluster routes and so the first thing the sketch does is query these API routes. These are updated every loop. The P5 sketch then renders all of this information onto the billboard as shown in the screenshots in the ‘interaction overview’ section. The icon displayed in the middle of the conditions region (top, green background) and the message displayed on the right side are selected based on the current weather conditions. The icons used are from RNS’s weather icon collection [5]. The messages can be configured using the API and in particularly dangerous conditions such as ice, snow or fog, these messages will flash alternating between white and red. The current speed limit is shown in a large speed sign in the middle left of the billboard. This is designed to be the most striking aspect of the billboard. The traffic map shown in the middle right of the billboard is updated dynamically with traffic information from the sensors. The average speed for each route is shown in a small speed sign next to each route, and the route is highlighted green if the average speed is above 50 mph, yellow if 30 – 50 mph, orange if 5 – 30 mph and red if less than 5 mph. Information about upcoming services is shown in the bottom left of the billboard and includes icons representing services available at that service station. The billboard can support up to 8 icons and will adjust the layout depending on the number of icons provided. Finally, a number of messages is shown on the bottom right of the billboard. If more then one message is provided, the billboard will cycle through the messages. This sign is designed to look like the MS4 signs currently in use and can be used to display safety prompts such as reminding drivers to wear a seatbelt.
Future Work
Given more time, there are a number of improvements I would like to make to the project. First, the traffic sensors base their speed estimates on the assumption that all vehicles are 4.4m in length. This means that the sensors could become confused by very long vehicles such as lorries or very short vehicles such as motorcycles and produce incorrect values. If I had more LDRs, I would have liked to introduce two LDRs per traffic sensor situated a known distance apart from each other. This would enable more accurate speed estimates to be obtained.
Secondly, the traffic map diagram on the billboard has been hardcoded in the sketch. I would have liked to develop a way that the layout of the route could be set in the configuration of the server, and therefore the sketch would not need to be modified when changing the number of sensors or route layout. This could be achieved through the use of some of domain specific language, or by the traffic map being a separate sketch developed for each individual cluster.
Finally, no security provisions have been made throughout this project. All of the API routes are available to anyone on the network without any kind of authentication. Whilst allowing the public access to the traffic sensor data via a public API is a key benefit of the project, clearly unauthorised access to the configuration of the sign could have dire consequences e.g., intruders tampering with the speed limit or displaying obscene messages on the billboard. This could be solved through a secure authentication process for the restricted routes, and taking standard security measures such as firewalls.
Conclusion
Traffic monitoring enables dynamic traffic management which can make roads more efficient and safer. Whilst some of this data is already gathered by existing smart motorway systems, very little of this data is shared with drivers and the public. A digital motorway billboard would enable drivers to take advantage of this information to plan routes more efficiently. It would also enable authorities to share safety information with drivers which has the potential to make the roads a safer place. The integration of APIs to update the information on the billboard in real-time enables authorities to dynamically update speed limits as well as customise the billboard to their liking. The use of APIs to access traffic information could even enable algorithmic updating of speed limits without requiring a human in the loop, as well as allowing outside applications to access traffic data. This could be very useful for applications such as sat-nav. The configuration APIs also make it possible for service stations to dynamically update information about the services they provide, such as updating fuel prices in real-time.
Despite its advantages and the effort taken to ensure the billboard is as readable as possible, it would need to prove that it can be legible when travelling at speed in real world conditions, for it to be worth implementing. The large size of the billboard may also prove to be economically unfeasible. The possibility for the billboard to distract drivers could also be a concern, and again this would need to be trialled in real world conditions.
References
[1] RAC 2022 “Smart motorways - what are they and how do you use them?”: https://www.rac.co.uk/drive/advice/driving-advice/smart-motorways/
[2] Institute of Civil Engineering 2022 “What are smart motorways and how do they work?”: https://www.ice.org.uk/news-and-insight/the-civil-engineer/august-2016/what-are-smart-motorways
[3] Wikipedia accessed in March 2022 “Smart motorway – Specifications”: https://en.wikipedia.org/wiki/Smart_motorway#Specifications
[4] Variable Message Signs Limited 2022 “MS3 product page” and “MS4 product page”: http://www.vmstech.co.uk/ms3.htm and http://www.vmstech.co.uk/ms4.htm
[5] RNS’s (Yorlmar Campos) Weather Icons https://iconstore.co/icons/rns-weather-icons
[6] Department of Transport 2013: “Road traffic sign images for reproduction”: https://www.gov.uk/guidance/traffic-sign-images
[7] Wikipedia accessed in March 2022 “Transport (typeface)”: https://en.wikipedia.org/wiki/Transport_(typeface)
[8] Nathaniel Porter “Transport Medium TTF file”: https://www.roads.org.uk/fonts
[9] https://fontforge.org/en-US/
[10] https://www.arduino.cc/reference/en/libraries/dht-sensor-library/
[15] http://expressjs.com/en/resources/middleware/body-parser.html
[16] https://www.npmjs.com/package/node-fetch
[17] https://nodemon.io/
PDF version: https://www.jbm.fyi/static/smart_motorway_billboard.pdf